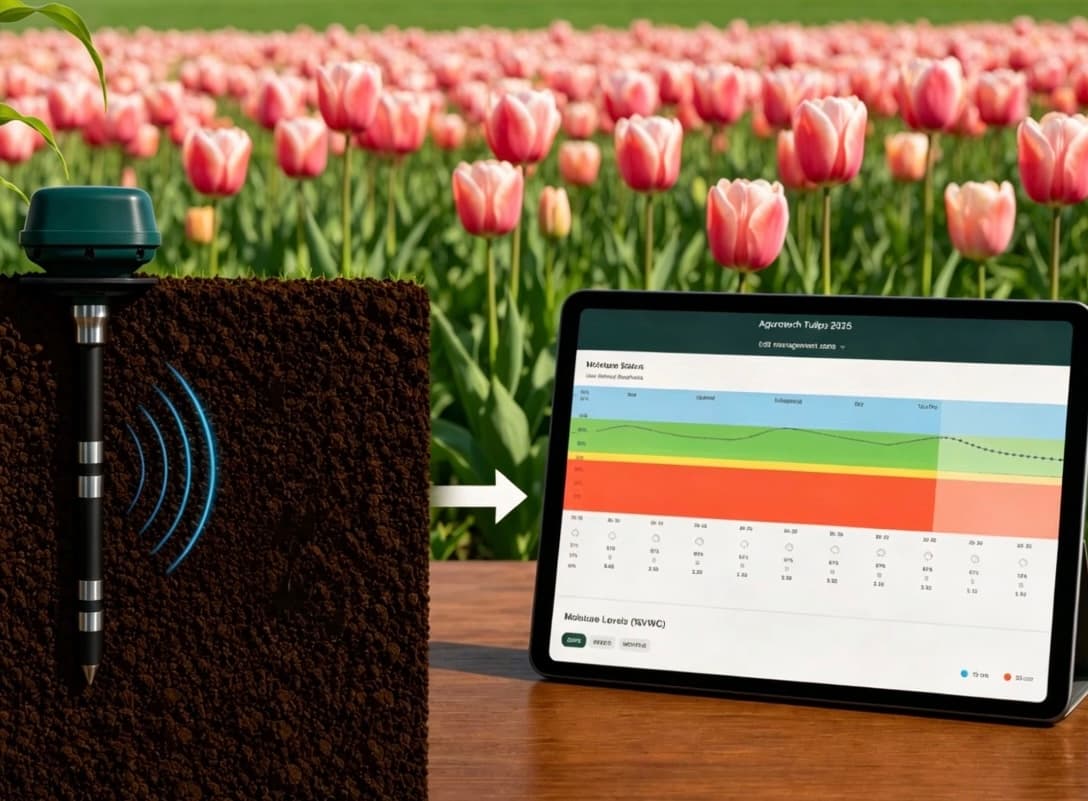
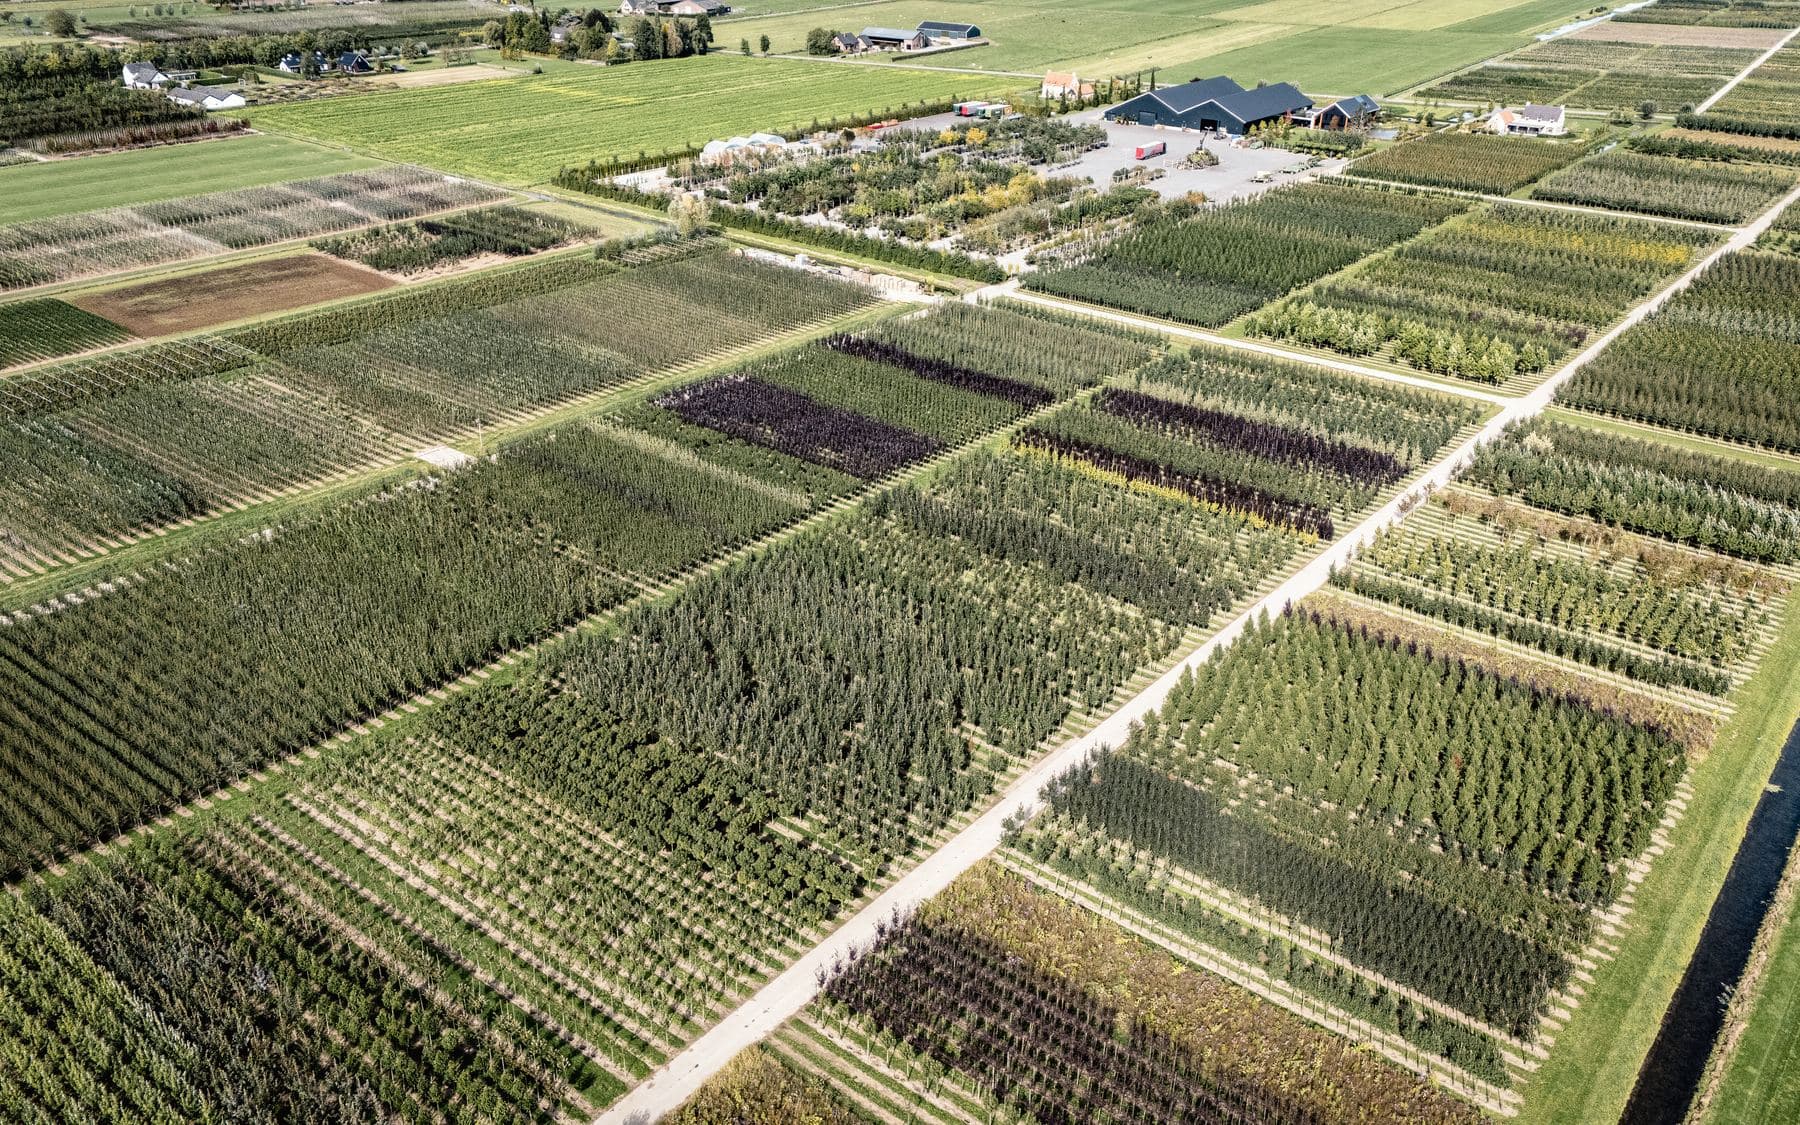
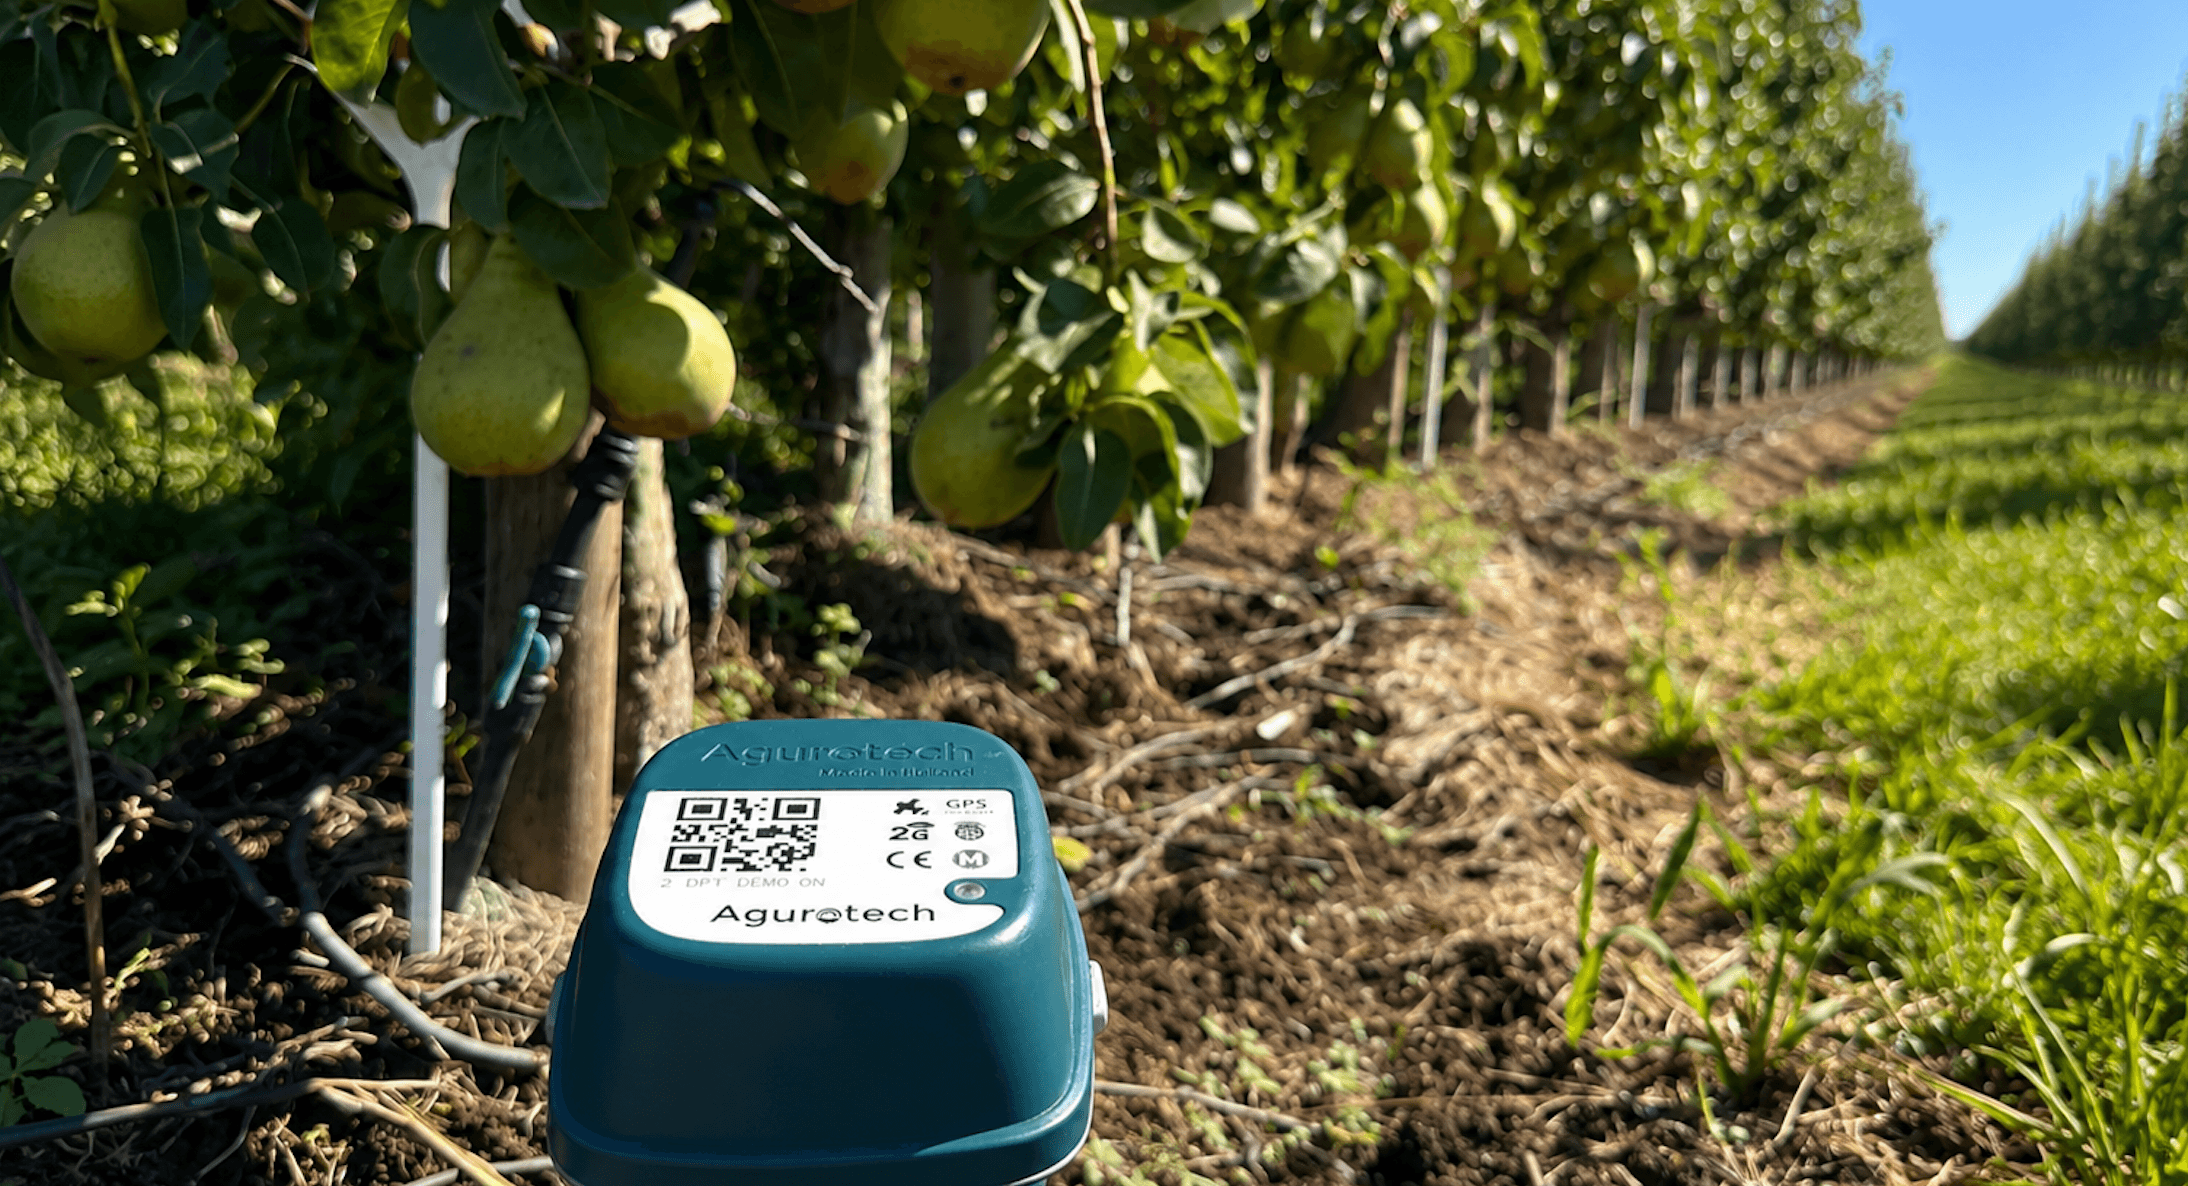
A soil moisture sensor shows how the moisture content in the soil changes. After a rainstorm, the reading rises; during a dry spell, it falls. This helps determine the right time to irrigate. But how representative is that measurement point of the entire field?
Every grower is familiar with variations within their soil. A shallow strip dries out faster, a low-lying area stays wet longer, and a former ditch can continue to influence water management for years to come. These variations are what make the combination of sensors and satellite imagery so valuable: you can view a local measurement in the context of the entire field.
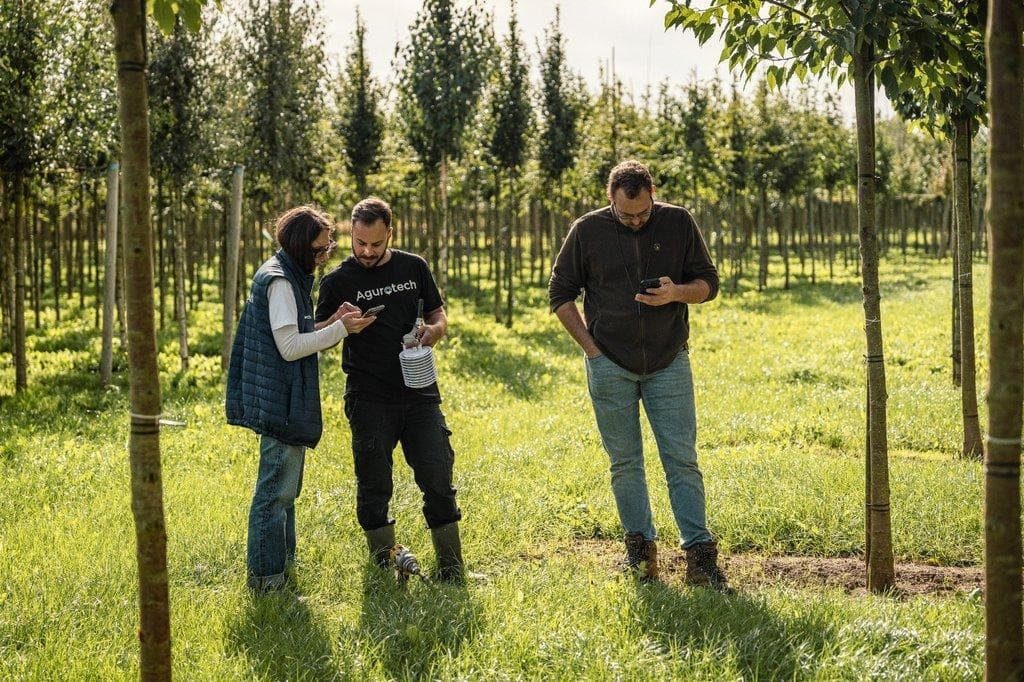
As part of the AgriScope project, Agurotech worked with growers and project partners to investigate how sensor data, satellite imagery, weather data, and AI can be integrated for this purpose. Now that we’re wrapping up the project, these insights are being incorporated into the technology that growers use every day.
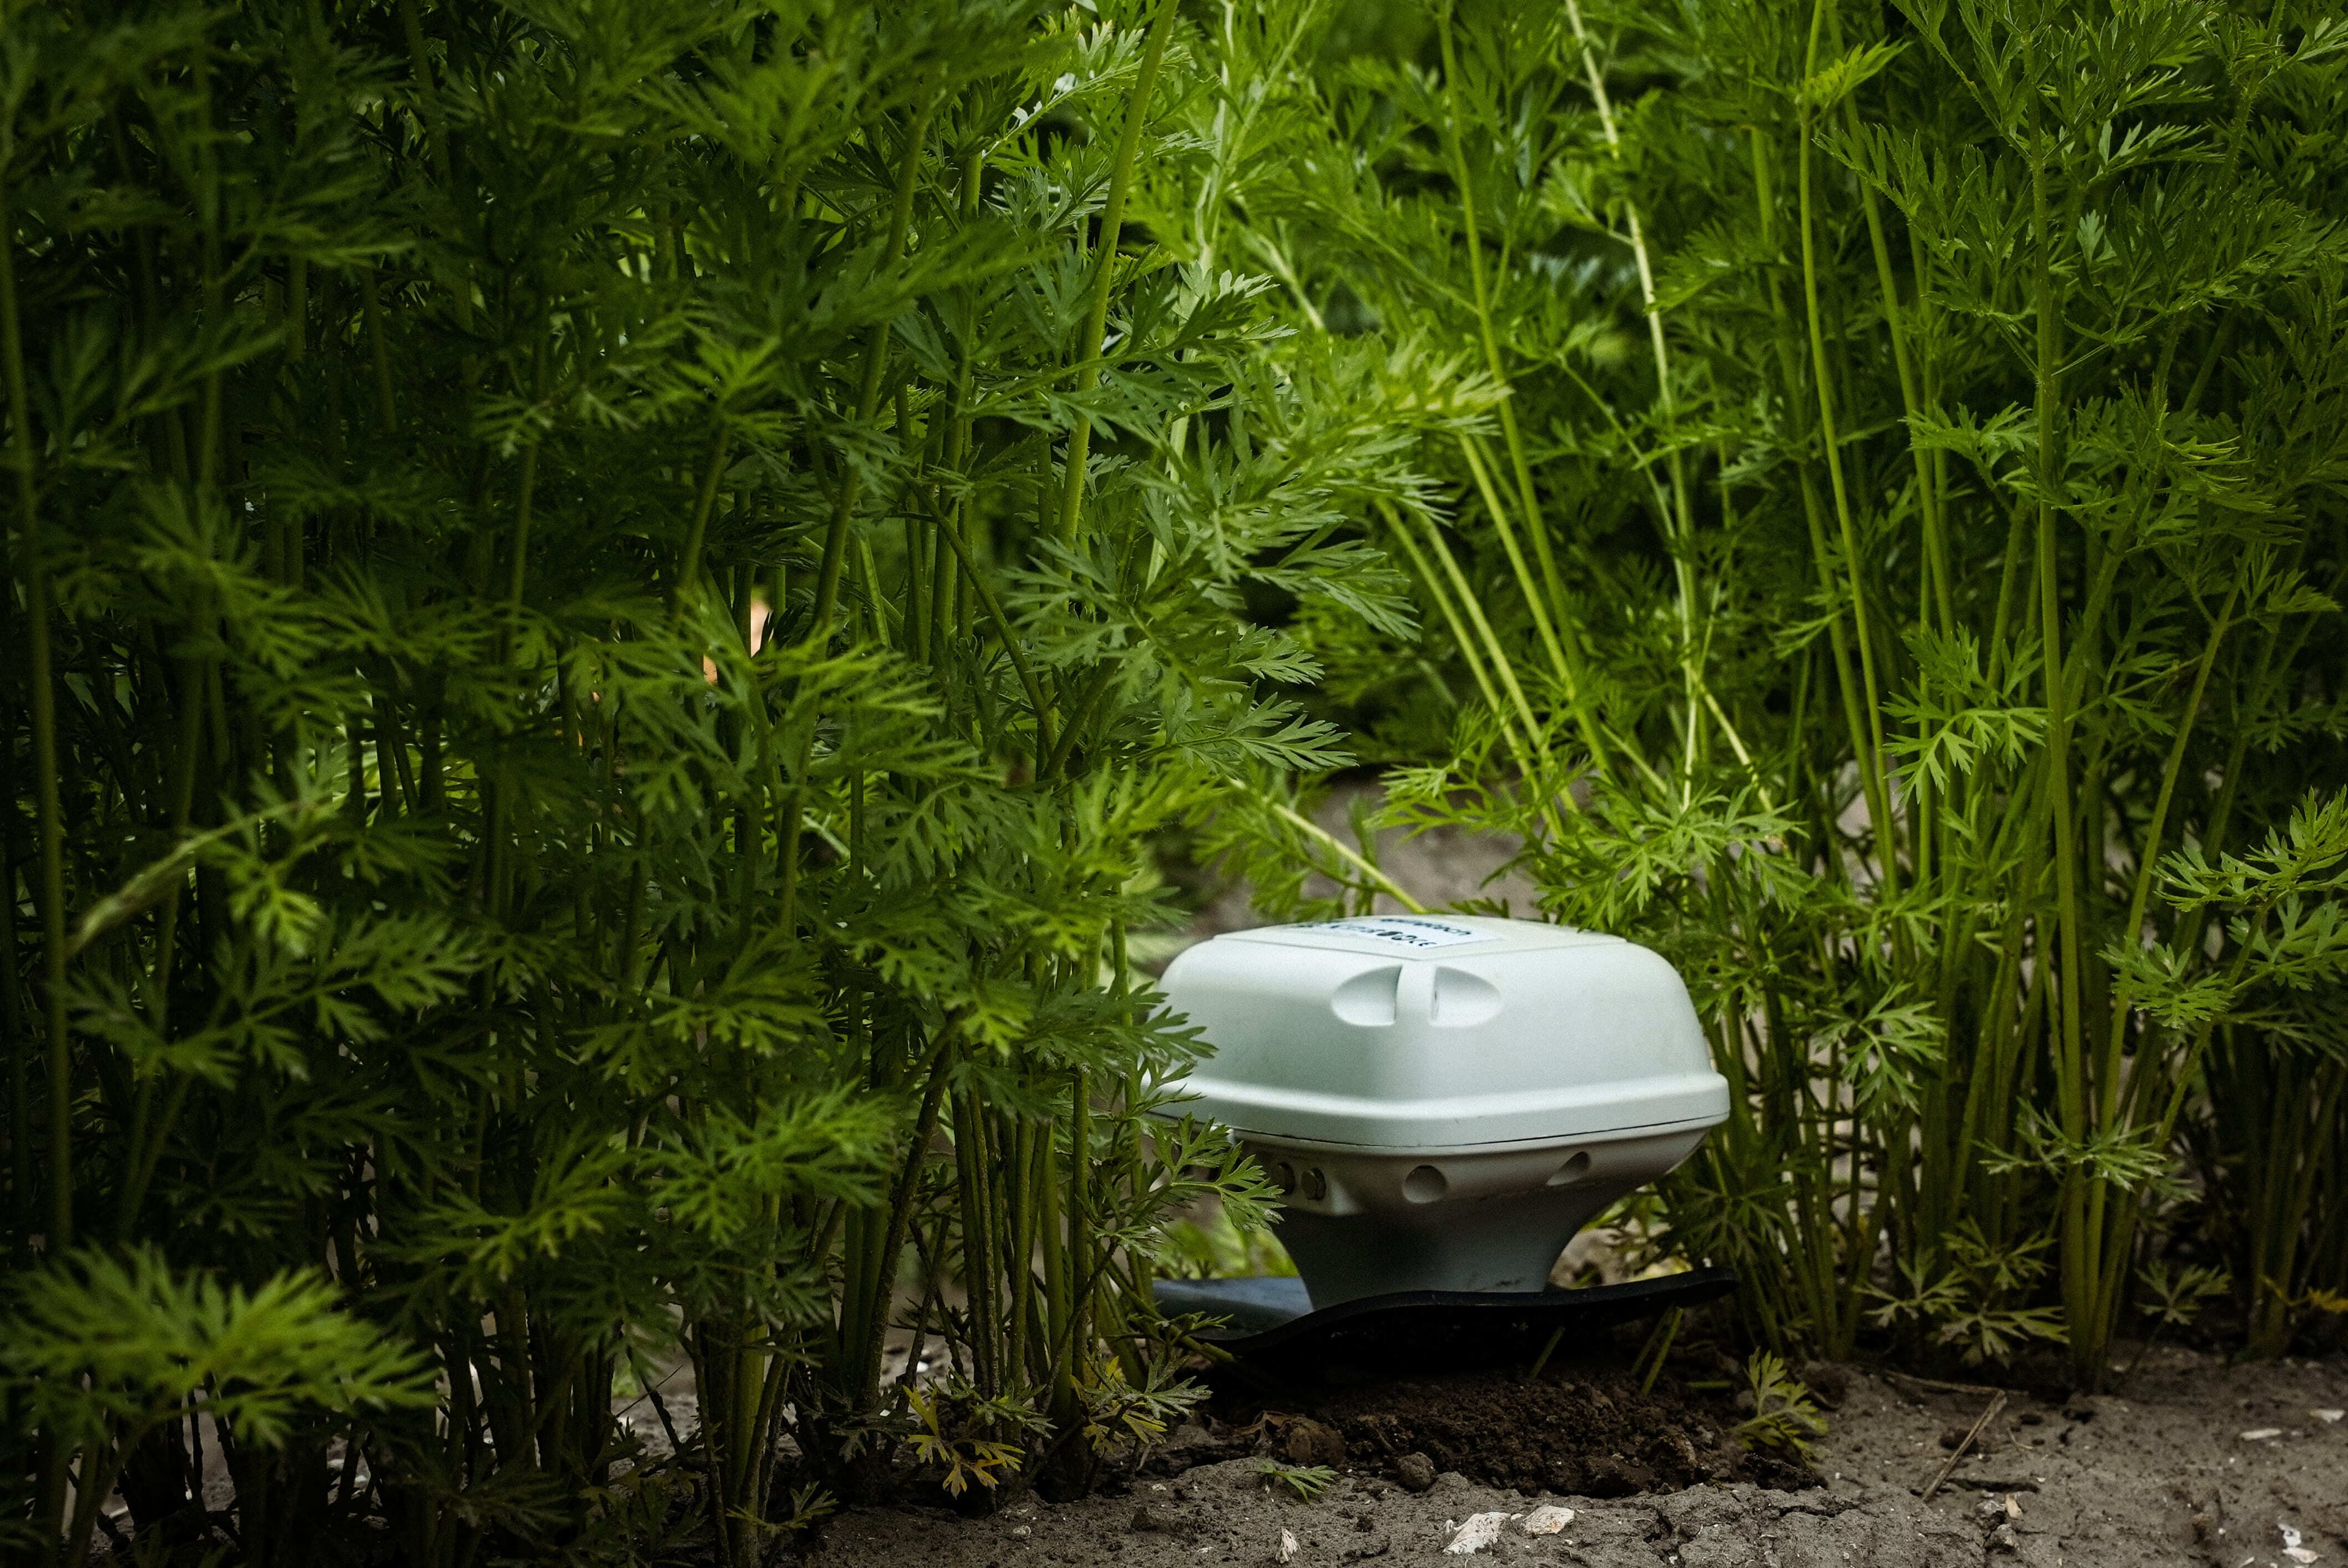
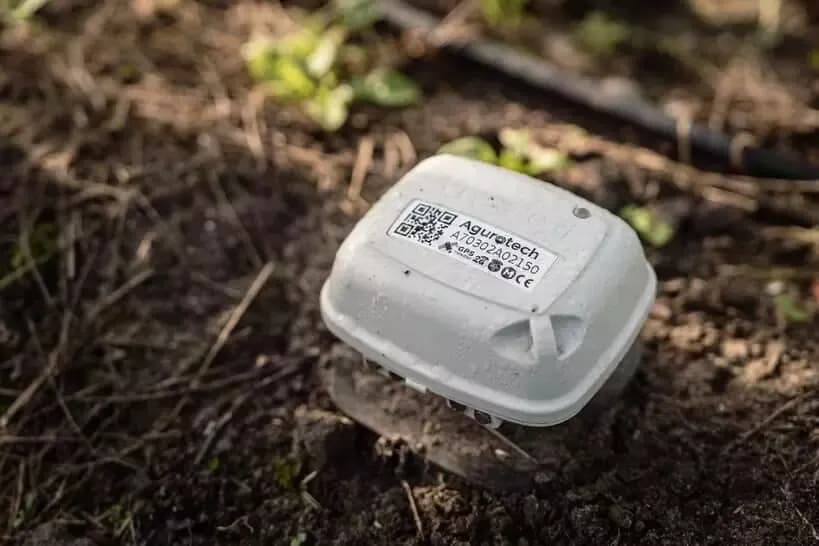
A sensor monitors what is happening in the soil at its measurement location. By taking measurements at different depths, you can see how moisture levels evolve in the root zone. Does rainfall reach the deeper soil layers? How long does moisture remain available there? And how quickly does the top layer dry out again?
The sequence of measurements provides a wealth of information. An isolated value gains meaning when you know what preceded it: rain, irrigation, or several warm days. By tracking these responses and comparing them with field observations, a grower gains an increasingly deeper understanding of the measurement site.
Satellite images add another scale to the analysis. They contain information about the surface and crop development, which can reveal variations within a plot. A satellite does not directly observe the root zone. A soil moisture map is created by combining satellite data with other information and translating it into an estimate of soil moisture.

This is where AI comes into play. Models learn to recognize correlations between satellite data, measured soil moisture, and conditions such as soil type and weather. These correlations help to make estimates even for areas without sensors.
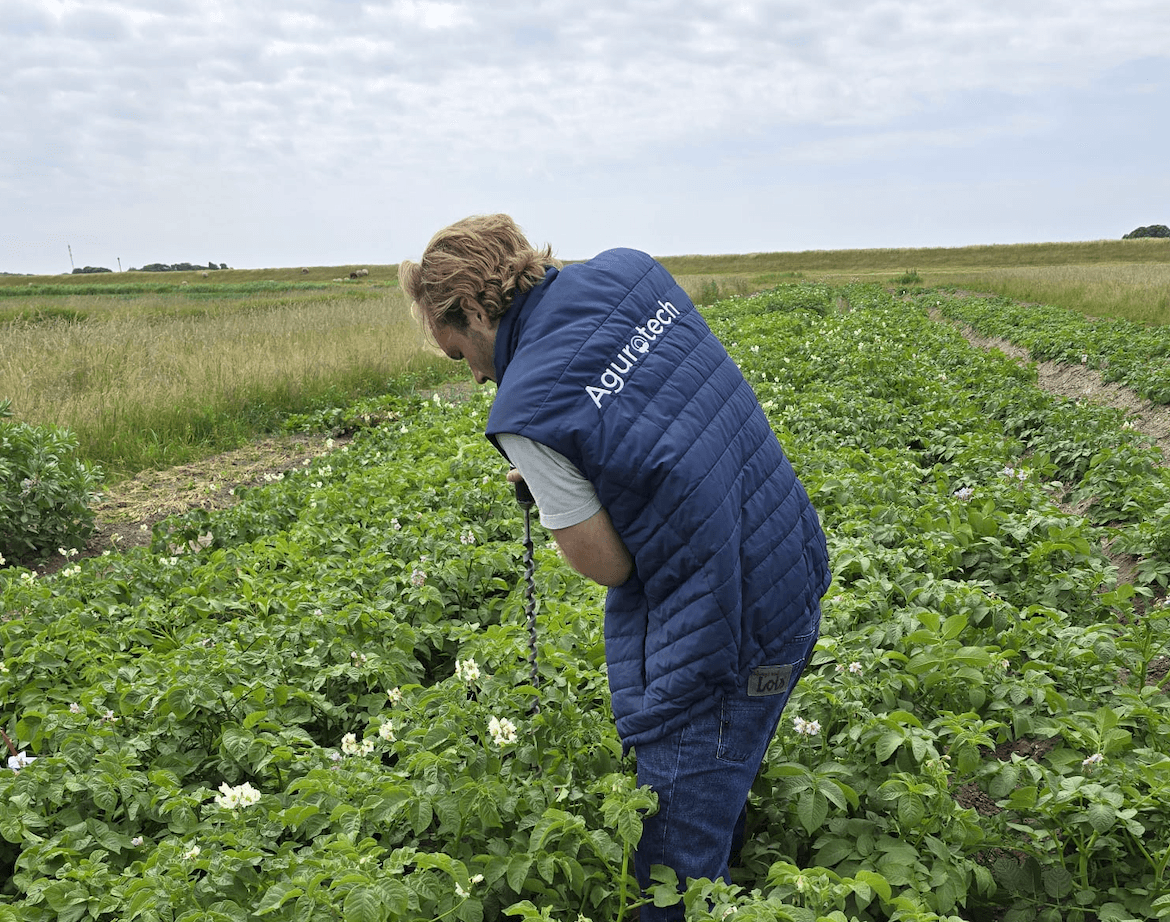
This requires high-quality field data. A model must be validated against measurements not used for training. Within AgriScope, this was done, among other things, on eleven validation plots, where the calculations were compared with independent sensor measurements. This reveals under which conditions the approach works well and where further refinement is needed.
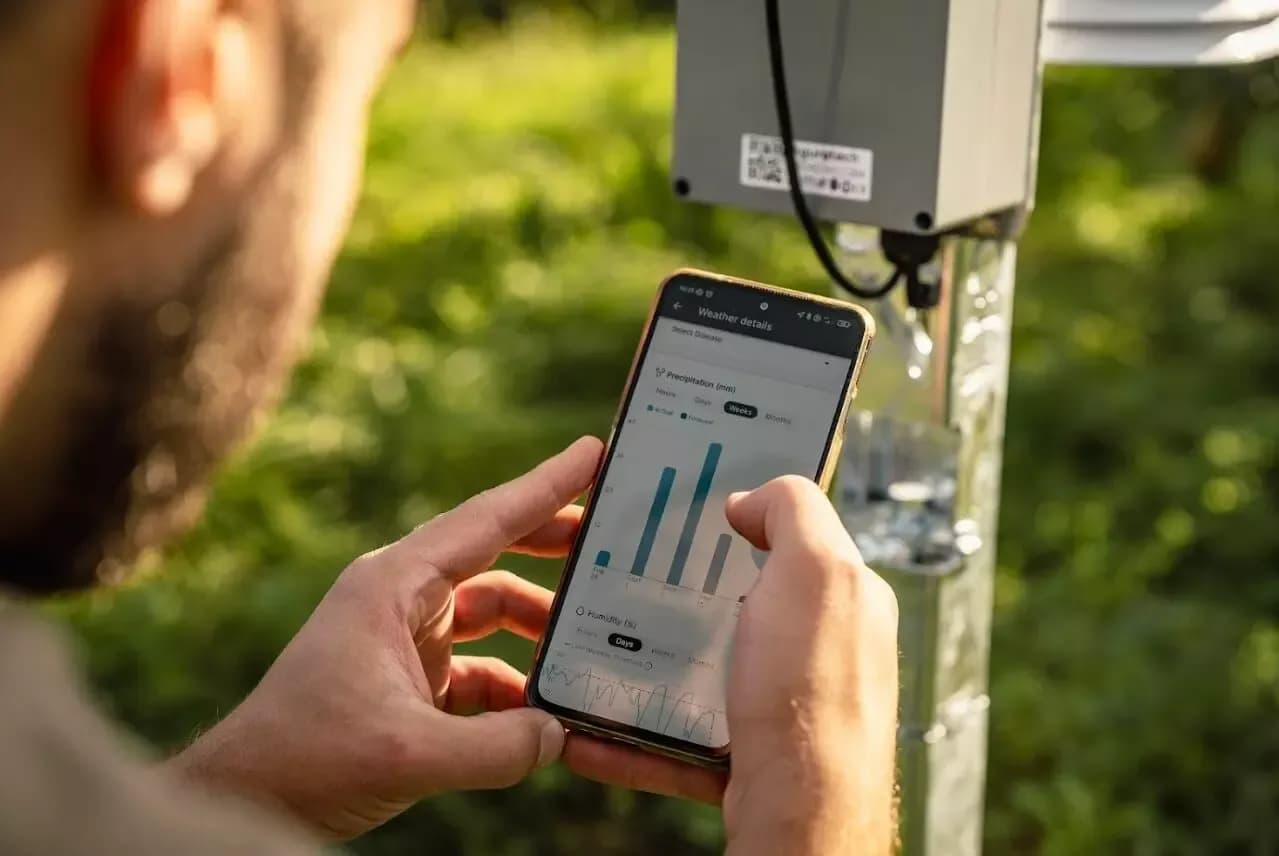
For the grower, the various sources of information come together in a map view. The sensor provides a local reference point; the satellite-based map shows the calculated moisture distribution across the plot. This allows you to determine whether the measurement location is relatively dry, wet, or representative of a larger portion of the field.
For example, a drier zone on the map may prompt you to take a closer look there. Can you identify the lighter-colored soil that dries out more quickly? Is there a difference in crop development? Does the pattern match previous observations? This combination helps you conduct field inspections in a more targeted manner and interpret measurements more effectively.
The timeliness of the information also matters. When it’s cloudy, a usable new satellite image isn’t always available. Meanwhile, rain, evaporation, and irrigation do change the soil moisture conditions.
To bridge those intervening days, a water balance can be used. It calculates how much water is added, lost, and remains available in the soil, based on factors such as weather, soil characteristics, the crop, and recorded irrigation.
That’s why it’s important to know whether you’re looking at a recent observation or a calculated estimate. Accurate input data also makes a difference. When an irrigation application isn’t recorded, the model lacks data on water that was actually applied to the field. Simple recording and data exchange thus directly contribute to the usability of the results.
In daily practice, all of this helps primarily with setting priorities. Which field requires attention? Where would an extra check be useful? Can an irrigation cycle wait, taking into account the weather forecast and available capacity?
The grower’s experience remains invaluable in this regard. The grower knows the soil, the crop, and the farm’s limitations. As measurements and maps reveal recognizable patterns, there is greater confidence in incorporating the information into planning.
At Agurotech, satellite data is therefore becoming an integral part of understanding the field. Automatic field boundaries simplify the setup of fields. The combined map view links sensor measurements with information about the entire plot. The insights from AgriScope help to further refine these applications and make them accessible.
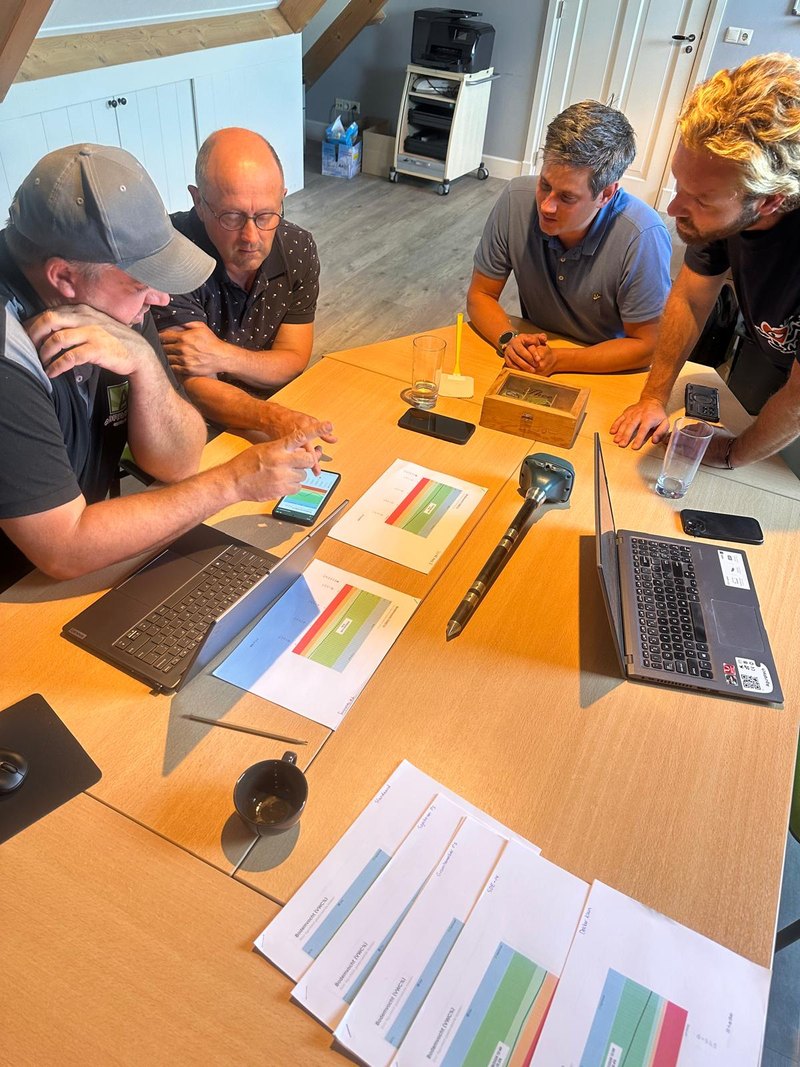
The next step is yield forecasting. Satellite data on crop development, combined with historical yields and plot data, can help estimate the expected harvest earlier. This application is still under development. To improve predictions for different crops, soils, and seasons, we are eager to collaborate with growers who are willing to share yield data.
Would you like to know how sensors and satellite data can work together on your farm, or contribute to the development of yield forecasts? Please contact Agurotech at info@agurotech.com.
.jpg&w=3840&q=75)